
Published October 7, 2026 | Update planned ~October 15 when SMDRA and CAR publish.
DENVER MARKET REPORT | OCTOBER 2026
What the Numbers Actually Mean for You
By Brian Trampler | Corcoran Perry & Co.
The Snapshot
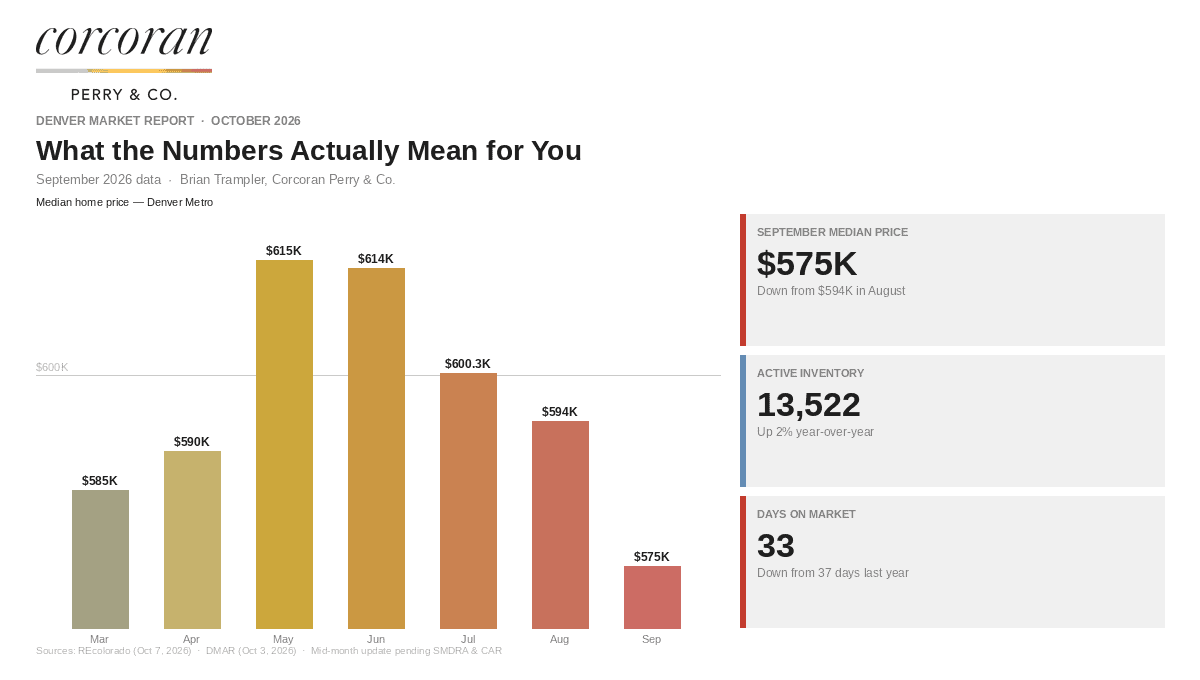
September came in as the sharpest pullback of the year. Prices dropped below $600K for the first time since early spring, closings were well off last year's pace, and buyers are clearly in no rush. But here's the wrinkle: homes that did sell moved faster than a year ago, and sellers got nearly everything they asked for. The market is sorting itself out, not falling apart.
Median Home Price: $575,000 (down 2% year-over-year, down 3% from August 2026)
Homes Sold / Closed Sales: 2,898 (down 18% year-over-year)
Pending Sales: 2,921 (down 13% year-over-year)
New Listings: 4,885 (down 1% year-over-year)
Active Inventory / Months of Supply: 13,522 active listings (up 2% year-over-year)
Days on Market: 33 days (down from 37 days a year ago)
Close-to-List Price Ratio: 98.45%
Rental Market: Median rent $2,600 per month (down 3% year-over-year)
Source: REcolorado, DMAR (October 2026 report). SMDRA and CAR data pending mid-month update.
What Happened in September
September reminded everyone that fall has a different tempo. The median price dropped to $575,000, the first time we've been below $600,000 since early spring, and closings came in 18% below where they were a year ago. On the surface that sounds rough. But dig one layer deeper and the story gets more interesting.
Homes that actually went under contract moved faster than they did in September 2025 — 33 days on market versus 37. And when sellers priced right, they got 98.45 cents on every dollar they asked for. That close-to-list ratio tells you motivated sellers who understood the market were not being picked apart by lowball offers. They were getting near-full price, just not instantly.
What you're watching is a market sorting itself. The inventory number, 13,522 active listings, is technically up 2% year-over-year, but closings were down 18%. That math tells you supply has a bit more runway than demand right now. Buyers have options. What they don't have is an unlimited timeline, because the homes worth buying aren't sitting forever.
The rental market adding to this context: median rent at $2,600, down 3% year-over-year. For buyers who've been on the fence about whether renting longer makes financial sense, the gap between owning and renting is tighter than it's been in a while. That's worth running the actual numbers on before assuming either direction is obvious.
If You're Buying
September was your kind of month, just not because prices collapsed. They didn't. They adjusted. And that adjustment, from $594K in August to $575K, combined with more inventory and sellers who are staying motivated, puts you in a better position than you were six months ago.
The days-on-market number is counterintuitive but important. Homes moved in 33 days on average, faster than a year ago. What that tells you is that the well-priced homes are still moving. The ones sitting are overpriced. When you find something priced correctly and it checks your boxes, the window is shorter than the overall market tone might suggest.
With closings down 18% year-over-year, there's less competition in the pool right now. That's the flip side of a slower market: fewer buyers chasing the same listings. DMAR's Amanda Snitker put it plainly: the fourth quarter tends to reward buyers who keep moving while others wait for a fresh start after the New Year. History backs that up.
If you're a Front Range relocator looking in the $250-350K range, the attached-home segment in Douglas and Arapahoe counties is worth a close look. That's where your budget has the most options right now, and where motivated sellers are most likely to negotiate.
The question worth asking yourself: If the right home came on the market today at the right price, are you actually ready to move on it, or are you still waiting for a signal that may not arrive?
If You're Selling — or Trading Up
The 98.45% close-to-list ratio is the number sellers should hold onto. It means the market isn't trying to steal from you. It's telling you what it will pay, and when sellers meet the market at that price, they're getting nearly full ask. The ones who don't are the 13,522 listings sitting in the active count.
If you bought in 2021 or before, you still have significant equity even at $575K. The conversation worth having isn't 'the market is down' — it's 'what does my net position actually look like, and where am I going next?' For most people who've held a Denver home for four-plus years, the equity picture remains strong.
For the seasoned mover, trading up in the same market is the move that often gets overlooked. If your current home is also being discounted slightly, and the home you're moving into is also being discounted, you're moving on a compressed spread in both directions. The relative advantage can be better than it looks from the outside.
Timing matters. October and November have historically been softer months for new listings. If you're serious about selling, the pool of competing listings may actually thin out before yours does.
The question worth asking yourself: Have you actually looked at what your home would net you today, or are you making decisions based on a number you heard six months ago?
The Local Angle
Denver metro's September data is metro-wide, but the experience on the ground varies by submarket. The closer-in neighborhoods — Washington Park, Wash Park West, Platt Park, Congress Park — tend to hold price better than the outer ring during softer months. Walkability and established infrastructure command a premium that doesn't soften as quickly.
The suburban markets further out, particularly in northern Arapahoe and southern Adams counties, are where inventory has built up most. That creates a buyer's advantage in those corridors that isn't present metro-wide. For buyers who have flexibility on location, this is where the negotiating room is.
Douglas County deserves a mention because it continues to attract Front Range relocators. The $250-350K attached-home segment there has real traction, and the commute-to-downtown math pencils out differently now that hybrid schedules have become standard. If you're moving from Colorado Springs, this is the first corridor worth mapping out.
The rental market sitting at $2,600 median, down 3% year-over-year, is a meaningful data point for investors watching the Denver market. It suggests rental demand is stable but not accelerating. For anyone doing a rent-versus-buy analysis right now, that number is your starting point for the comparison.
October begins with the numbers reflecting a market that's recalibrating, not retreating. The ingredients that held Denver's market together — strong employment, net in-migration, a continued lack of distressed sellers — haven't changed. What's changed is that buyers have more leverage than they did at the start of 2026, and sellers who understand that are still closing near full ask.
The SMDRA and CAR city-level data will be in mid-month. Check back for the update, which will add suburb-specific numbers across the 7-county south metro.
Questions About What This Means for You?
These numbers are useful. But they're averages, and your situation isn't average. Whether you're thinking about buying, selling, or just trying to figure out where things are headed, I'm happy to look at the specific numbers that matter for your decision.
Every situation is different, and the numbers above are a starting point, not a verdict on your specific home or your specific search. If you want to talk through what any of this means for you, I'm glad to do that.

If something in here raised a question about your situation, I'm happy to talk it through. No agenda — just a straight conversation.
Reach out here
No pitch, no pressure. Just a conversation about what the data actually means for what you're trying to do. Reach out here.











Socials